I've spent over a decade implementing business intelligence systems across multiple industries. I've watched law firms, professional services firms, and corporations invest hundreds of thousands into powerful BI platforms. And I've watched almost all of them fail in the exact same two ways.
Before we talk about how to build BI that works, we need to understand why it usually doesn't.
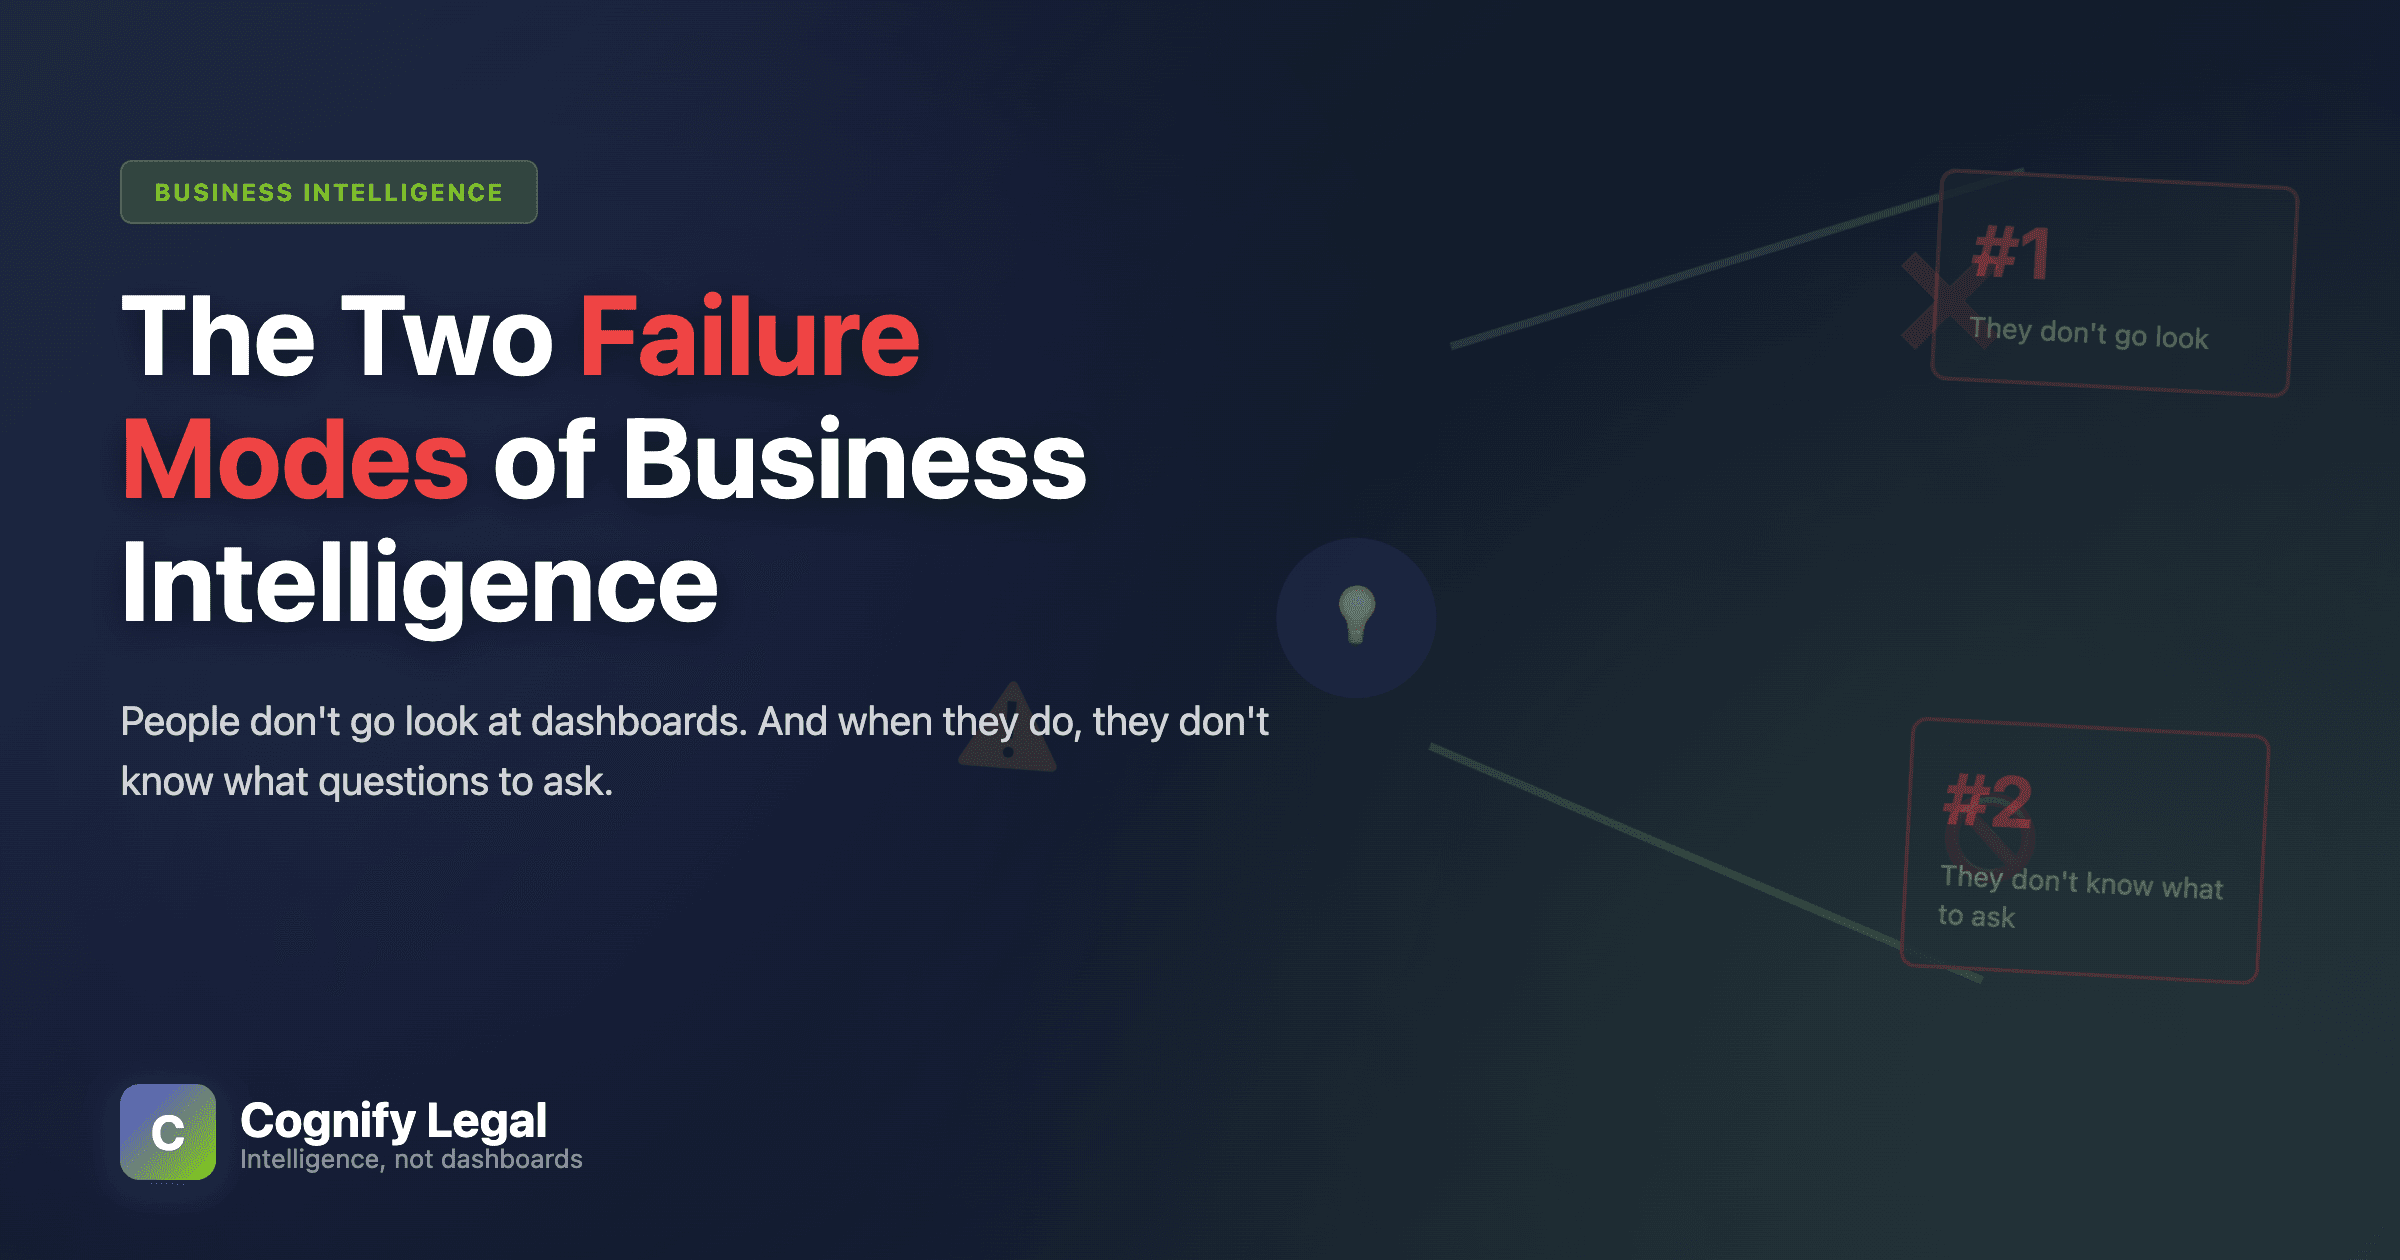
Problem One: People Don't Go Look
This is the most visible problem, and the one that hits you first. You've invested £50K in Power BI. You've hired consultants. You've built beautiful dashboards with every metric imaginable. You've trained your team. And then...
Nothing.
The dashboards sit there, gathering digital dust. Login rates drop from 15% in month one, to 5% in month three, to effectively zero by month six. Partners claim they're too busy. Associates say they "can't find what they need." The Managing Partner checks in once a quarter, takes a screenshot for a board meeting, then doesn't log in again until next quarter.
Why This Happens
There are five fundamental friction points that kill dashboard adoption:
Context switching cost is too high.
Partners are already in Teams, Outlook, and their practice management system. Asking them to open another application—even a browser tab—creates a barrier that feels insignificant but proves insurmountable.
Information isn't time-sensitive.
Unlike email (which might be urgent) or Teams messages (which might be from clients), BI dashboards represent historical data that will still be there tomorrow. Without urgency, they never become habitual.
The ROI of any single visit is unclear.
What will I learn from logging in right now? Is it worth interrupting what I'm doing? Usually, the answer is "probably not," so people don't.
Dashboards don't remind you they exist.
Email reminds you with notifications. Teams reminds you with badges. Your practice management system reminds you because you have to use it. Dashboards just sit there, passive and forgettable.
The interface is cognitively demanding.
Even well-designed dashboards require orientation: Where am I? What am I looking at? What time period is this? What do these numbers mean? This cognitive load makes casual "checking in" feel like work rather than insight.
We went from 15% of partners logging in regularly in the first month to maybe 5% by month three. By month six, it was basically just me and the finance director. And I'm the one who built it.
Practice Manager at 50-person UK law firm
The tragedy is that the information is valuable. Partners would absolutely benefit from knowing their utilization is trending down, or that a client's outstanding invoices are aging past 90 days, or that their team's realization rate is 8% below target. They just won't go find it themselves.
Problem Two: People Don't Know What to Ask
Let's say you've somehow solved Problem One. You've managed to get people actually opening the dashboard. Maybe you've made it the default homepage. Maybe you've sent persistent reminders. Maybe you've tied it to compensation reviews.
Now you hit Problem Two: they don't know what to look at.
This is more subtle, but ultimately more destructive. Partners stare at screens full of metrics and charts and have no idea which numbers matter or what questions they should be asking.
The Knowledge Gap
Here's what happens: A partner logs into the dashboard and sees her utilization is 73.2%. Is that good? Bad? She has no baseline for comparison. She sees the firm's collection rate is 87.4%. Okay, but what should it be? She notices WIP has increased 12% from last month. Is that concerning, or just seasonal variation?
The dashboard is providing data, but the partner lacks the domain knowledge to turn that data into insight. She doesn't know:
What the normal range is for any given metric
How her numbers compare to peers or practice area averages
Whether a change represents a trend or noise
What thresholds should trigger concern or action
What questions she should even be asking
Finance directors and practice managers have this context because they work with these metrics daily. They know that 87% collection rate is concerning because the firm target is 92%. They know that 12% WIP increase in November is normal because Q4 always builds up unbilled time before year-end invoicing. They know that 73% utilization looks fine but is actually 8% below this partner's historical average.
Partners don't have this context. And the dashboard doesn't provide it.
The Questions They Should Ask
When I sit down with a partner and their dashboard, I can typically identify 3-4 issues that need immediate attention within about 30 seconds. Not because I'm particularly clever, but because I know what to look for:
Unbilled time aging past 45 days (indicates revenue at risk)
Utilization trending down 3+ months in a row (indicates capacity problem or lost work)
Collection rates diverging from firm average (indicates client payment issues or write-offs)
WIP growing faster than billing (indicates potential realization problems)
Sharp changes in any metric week-over-week (indicates data quality issues or real events that need investigation)
The partner, staring at the same dashboard, sees none of this. They see numbers. They don't see problems.
Fundamental Tension
The Fundamental Tension
Traditional BI assumes users know what questions to ask. It's built for analysts who understand the data model, know the business context, and can formulate sophisticated queries.
Law firm partners need the opposite: A system that tells them what questions they should be asking, identifies problems proactively, and explains what the numbers mean in their specific context.
This isn't a training problem. It's an architecture problem. Dashboards were never designed for this use case.
The Combined Effect
These two problems compound each other viciously:
Partners don't log in regularly because there's too much friction and unclear value. When they do log in, they don't get value because they don't know what to look for. This confirms their initial instinct that the system isn't useful, so they stop logging in. The cycle reinforces itself.
Meanwhile, the firm has spent £100K+ on a system that sits unused, and leadership concludes "our partners just aren't data-driven" or "we need better training" or "maybe we bought the wrong platform." None of these are the real problem.
What Actually Works
The solution isn't better dashboards, more training, or stronger mandates. The solution is fundamentally rethinking how business intelligence gets delivered:
1. Intelligence must come to users, not wait for users to come to it. That means embedding insights in the tools people already use (Teams, Outlook, Word) rather than asking them to context-switch to a separate platform.
2. The system must identify problems proactively, not wait for users to ask the right questions. That means alerts, feeds, and notifications that say "here's what you need to know" rather than dashboards that say "figure out what matters."
3. Insights must include context, not just data. That means explaining not just "your utilization is 73%" but "your utilization is 73%, which is 8% below your 6-month average and 5% below your peer group—this typically indicates either capacity for new work or time being misallocated."
4. The interface must be conversational, not analytical. That means "What's my utilization?" and "Which matters have unbilled time aging?" rather than filters, date ranges, and drill-down menus.
This is why we built Cognify the way we did. Not because we wanted to build "yet another BI tool," but because we watched traditional BI fail the same way, at firm after firm, for over a decade.
The Real Lesson
The failure of traditional BI in law firms isn't about the technology. Power BI is powerful. Tableau is sophisticated. Qlik is flexible. They're all excellent tools.
The failure is a mismatch between what these tools were designed for and how law firms actually work. They were built for analysts who would spend hours exploring data. Law firms need intelligence for lawyers who have 30 seconds between meetings.
Once you understand this mismatch—once you see both failure modes clearly—the path forward becomes obvious. Not better dashboards, but a fundamentally different approach to how business intelligence gets delivered.
That's what we're building at Cognify. Not another dashboard platform, but intelligence that actually works the way law firms work.
Matt Todd
Founder & CEO, Cognify Legal
After more than a decade implementing BI systems across industries and watching them consistently fail to achieve adoption, Matt founded Cognify to solve the fundamental problem: people don't open dashboards. Previously an enterprise consultant specializing in digital transformation and business intelligence.
Learn more about our story →